Technical Note: Ratiometric Analysis with the SC-41 Plate Reader
publication date: Nov 11, 2022
|
author/source: Edinburgh Instruments Ltd
Introduction
The SC-41 Plate Reader, a fluorescence plate reader, enables high throughput measurements on the FS5 Spectrofluorometer via the automated measurements of microwell plates. Standard and custom microwell plates can be measured containing up to 384 wells. Both spectral and lifetime measurements can be acquired, a unique feature of the SC-41. This technical note demonstrates the use of the SC-41 Plate Reader for ratio analysis. The emission spectra can be measured from each well where samples contain varying ratios of two fluorophores.
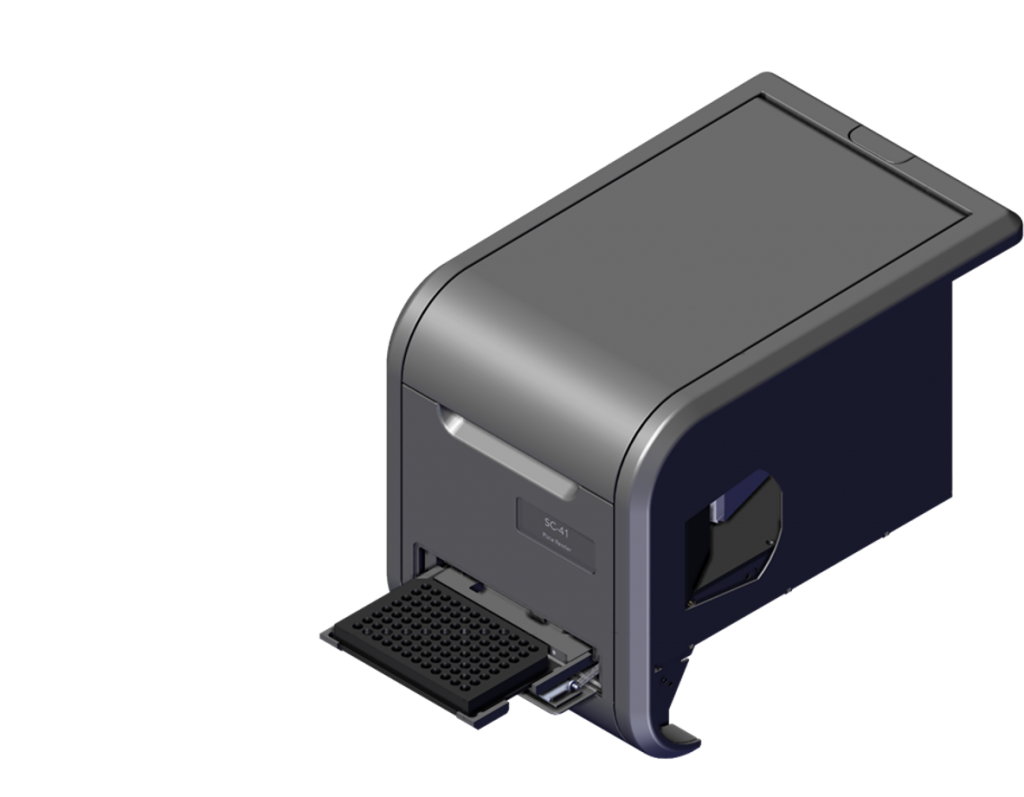
Figure 1: SC-41 Plate Reader Sample Module for the FS5 Spectrofluorometer
Experimental Setup
Solutions of Fluorophore 1 (F1) and Fluorophore 2 (F2) in 50:50 solution of water and ethanol were prepared at different F1:F2 ratios, Table 1. Samples 1 to 6 have a known F1:F2 ratio and were used for the creation of a calibration curve, whereas U1 and U2 have an unknown F1:F2 ratio which are to be experimentally determined. 300 μL of each sample was pipetted into a Greiner 96 well plate.
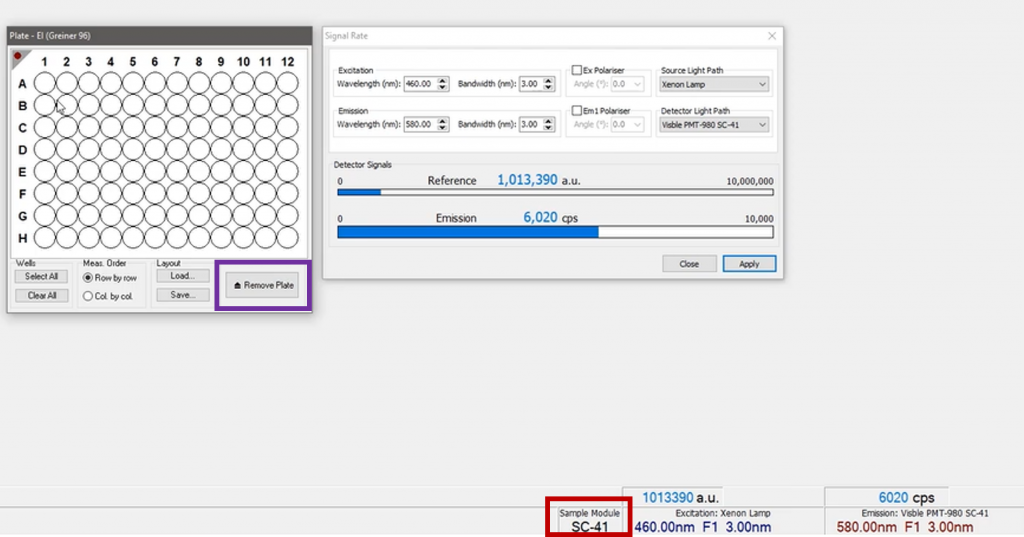
The SC-41 Sample Module was placed into the sample compartment of the FS5 Spectrofluorometer and automatically recognised by Fluoracle®. The filled microwell plate was then loaded into the SC-41 by pressing the Remove Plate/ Load Plate button.
Figure 2: Fluoracle® software showing auto-recognition of the sample module (outlined in red), and the well plate schematic with plate loading (outlined in purple)
Wells are displayed as individual circles, right-clicking a well moves the plate reader to this position and the live emission count rate can be seen for the well. This allows the user to check measurement parameters, such as bandwidth, before taking a measurement. Left-clicking on a well selects it for measurement and highlighted in blue. Well measurement patterns can be saved and loaded for future use.
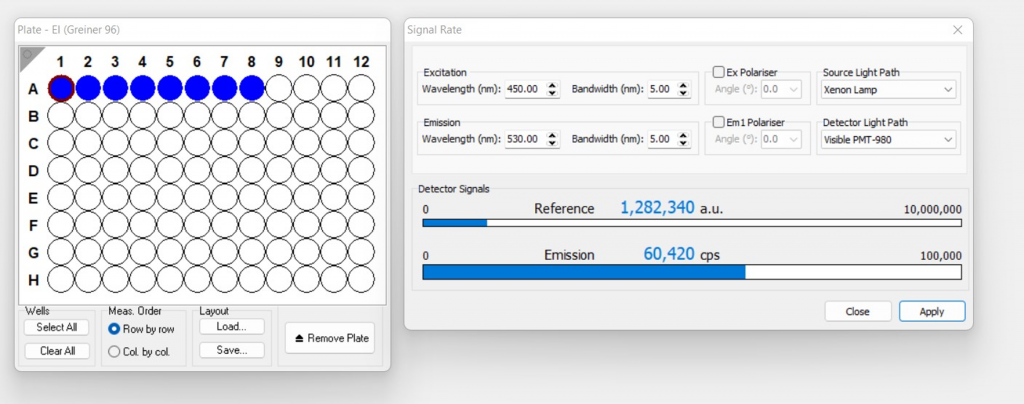
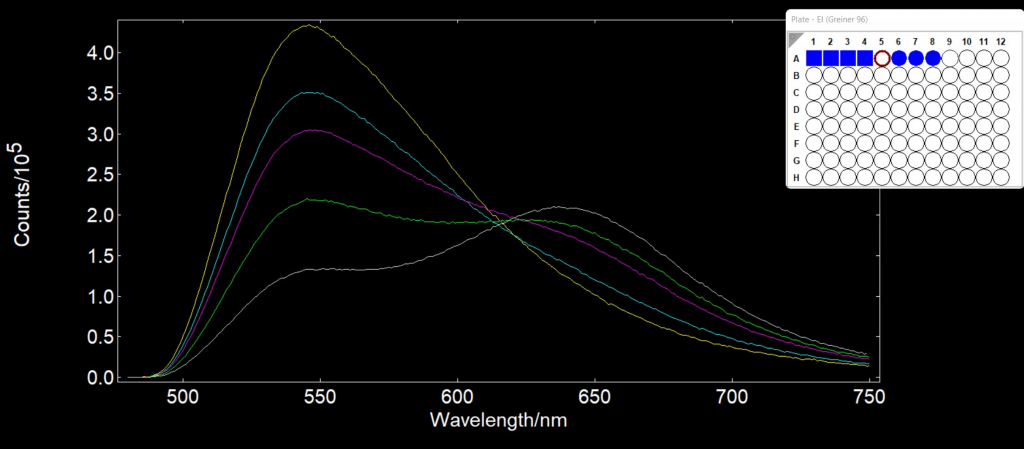
Figure 3: SC-41 plate set up in Fluoracle
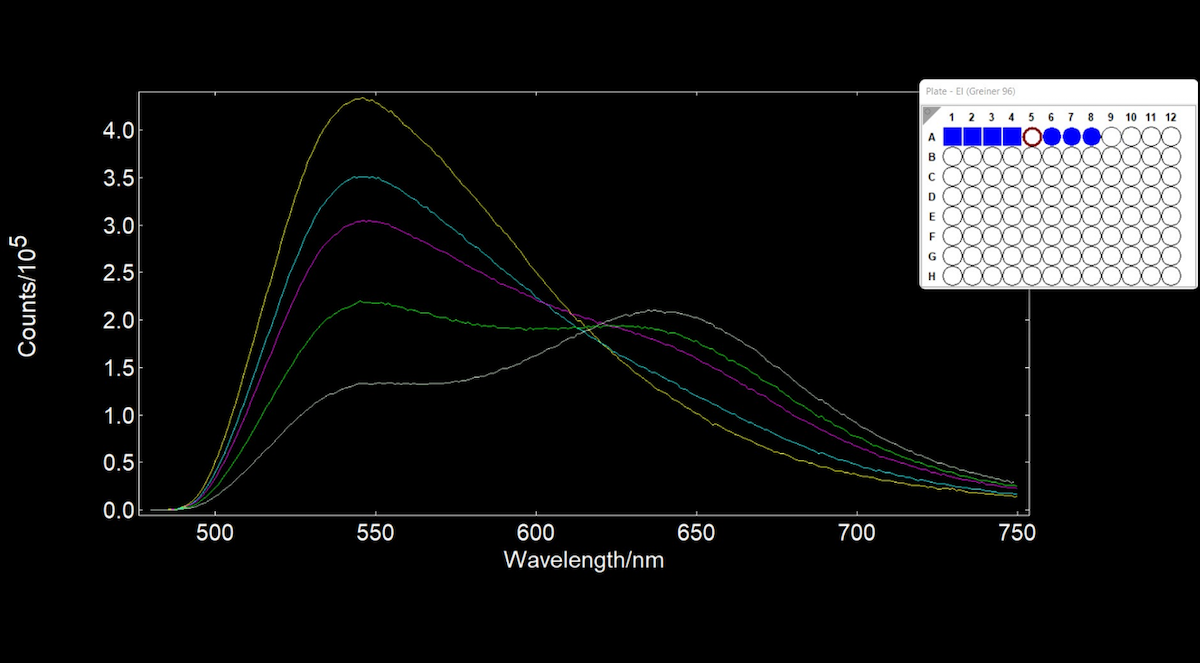
Wells A1-A8 were selected for measurement and bandwidths determined by moving the plate reader to the sample with the highest emission to ensure the detector was not saturating. Emission spectral scans from 480 nm to 750 nm were defined with a 1 nm step and 0.5 s integration time.
During the measurements the live emission scans are shown alongside a schematic of the microwell plate highlighting which well is currently being measured, shown by the circle becoming white with a red outline. When an individual well measurement is complete the circle will become a square, and once all measurements are complete the schematic will close.
Figure 4: Live measurement screen for the SC-41 Plate Reader
Ratio Trend Analysis
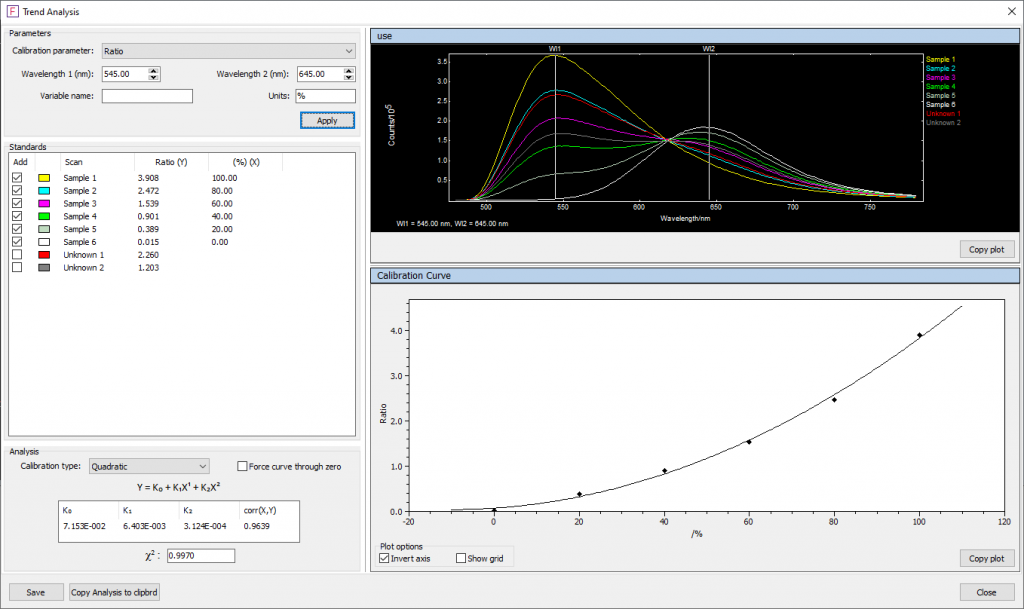
The spectra were then analysed using Fluoracle® Trend Analysis. Ratio analysis was chosen and the wavelengths of the emission peaks of F1 and F2 input, from which an intensity ratio is calculated. Samples 1 to 6 with a known fluorophore concentration ratio were selected and the concentration ratio entered as a percentage as shown in Figure 5. From this data Fluoracle® produced a quadratic calibration curve from which the equation can be used for determining the ratio of the fluorophores in the two unknown samples.
Figure 5: Ratio Trend Analysis using Fluoracle
Using the equation produced by Fluoracle® , Unknown 1 was determined to contain 74.8% Fluorophore 1 and 25.2% Fluorophore 2. Unknown 2 contained 50.5% Fluorophore 1 and 49.5% Fluorophore 2, Table 2.
Table 2: Unknown Fluorophore Ratios
Sample
% Fluorophore 1
% Fluorophore 2
U1
74.8
25.2
U2
50.5
49.5
Conclusion
The SC-41 Plate Reader enables automated measurements using the FS5 Spectrofluorometer and microwell plates. The Trend Analysis feature in Fluoracle® can then be used to plot a calibration curve which allows the determination of the ratio of each fluorophore in unknown samples.
If you would like to find out more about the SC-41 plate reader and how it can be used to improve your high throughput analysis on the FS5 Spectrofluorometer, contact our sales team who will be happy to help you.
Download
Download the full Technical Note: Ratiometric Analysis with the SC-41 Plate Reader to discover how our fluorescence plate reader can be used to facilitate high throughput analysis on our FS5 Spectrofluorometer.